
The 5 Stages of Value Maturity
December 10, 2020
How To Avoid Christmas Conflicts
December 15, 2020What Is The Value Gap?

In my last entry, I laid the groundwork for today’s topic. Over the last several weeks, we’ve covered the wealth gap, extensively. But today, we’re turning the corner just a little bit. With that said, today’s article is all about the value gap. What is it? What does it mean? and How does it impact your business?
Follow Along With The Financially Simple Bizcast!
TIME INDEX:
- 01:11 – What is the Value Gap
- 01:24 – What is Value
- 03:01 – Determining the Value Range
- 04:25 – Finding Where Your Business Lies on the Performance Bell Curve
- 10:40 – What Does All This Have to do with Value
- 12:22 – The Rule of 5
- 15:21 – Summary
What Is The Value Gap?
Before we can really dig into the value gap, we need to understand the terminology. Just on our site alone, there are many different types of value listed. There’s fair-market value, strategic value, liquidation value, book value, collateral value, etc., Merriam-Webster defines value as, “the regard that something is held to deserve; the relative worth, utility, or importance of something.” But, when I am talking about value, in this regard, I am speaking of intrinsic value.
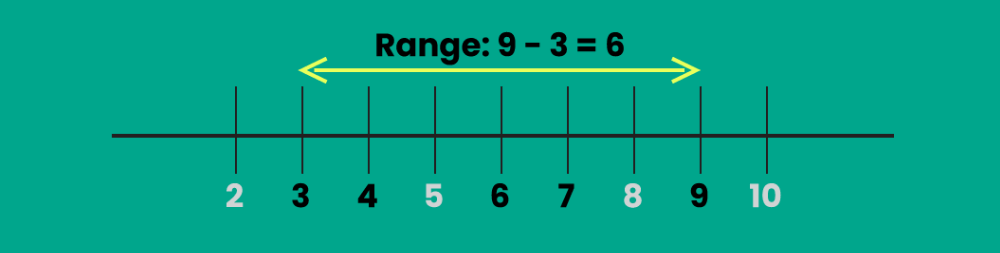
When dealing with value, we often have to determine the range, as well. We home school our kids and, as a result, we’ve found some very useful teaching tools online. One of the tools we use is a math program called, Math is Fun. They explain that a range is the difference between a low value and a high value. For example, the range between 3 and 9 is 6. But range can be a little misleading sometimes. I mean, what if you had five businesses in a group and one sold for a very low value while another sold very high? Does that mean that the remaining three are valued by the range of the low-value and high-value businesses? Not at all. That’s where standard deviation comes into play.
Standard Deviation: Is There Anything Standard About It?
If you remember how standard deviation works, excellent. However, if you’re like so many others, you’ve forgotten most of what you learned in your high school math classes. For all of you, I’m going to try to simplify this. But first, we’re going to go a little further into the weeds.
The Standard Deviation measures how “spread out” a group of numbers is. Its symbol is σ (the Greek letter sigma). Even though we’re getting into using the Greek alphabet for mathematical equations, the formula is easy. It is the square root of the variance. I know, you’re sitting there saying, “Thanks, Justin. That was super helpful. What is the Variance?” I’m glad you asked. The variance is defined as the average of the squared differences from the mean.
In order to calculate the variance, you must complete the following steps:
- Work out the mean (the simple average of the numbers)
- Then, for each number: subtract the mean and square the result (the squared difference).
- Then, work out the average of those squared differences.
Okay, I think I’ve put you through enough for now. So, let’s simplify things.
For Whom The Bell Curves
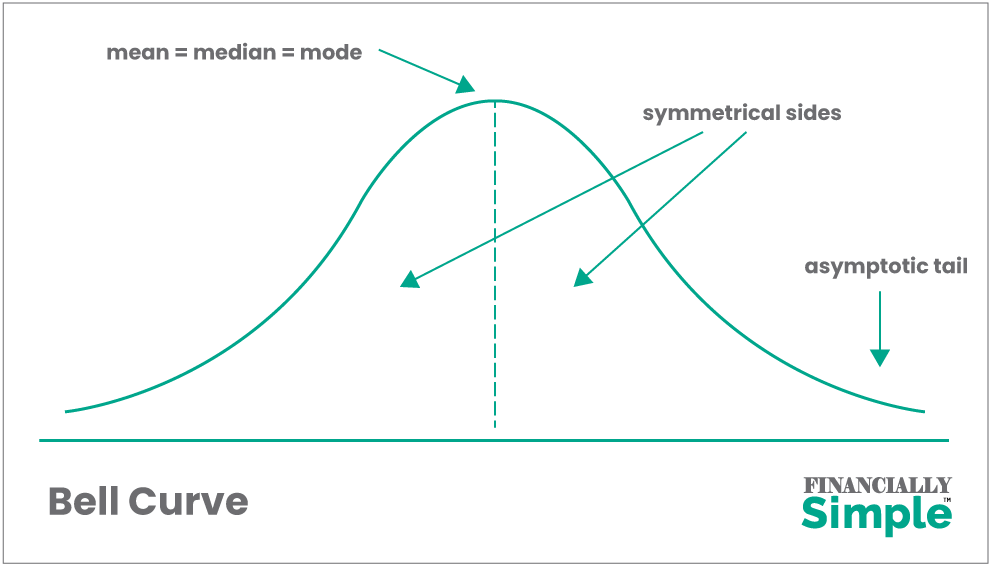 Do you remember the bell curve from grade school? Well, it’s a simple way to visualize the standard deviation, mean, and variance. On the left-hand side of the bell, you have your low values. The high values are on the right side, and the mean is dead center.
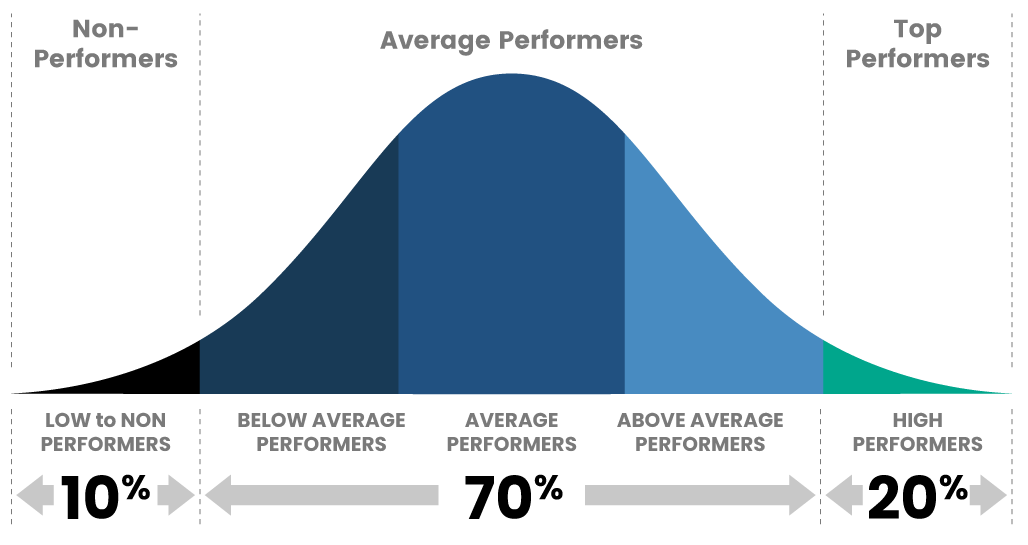
What each of these sectors represents are the averages within a given dataset. The mean is the absolute average, right in the middle. The downward symmetrical sides to the left and right of the mean represent the below-average and above-average range. This is where 70% of all businesses reside. But here’s where it gets interesting, folks. 10% of businesses fall in the low average or non-performers area found on the left-hand asymptotic tail. However, only 20% fall into the right-hand asymptotic tail which is where the high performer range is located.
So, with this fresh in our mind’s eye, think about where your business would fall on this bell curve. If your business is average, it’s going to fall somewhere in the middle. Now, you may be slightly to the left or right of the mean, but 70% of businesses are in this range. If you’re being honest with yourself, you’ve probably put your business in this range as well. The bottom 10% aren’t likely to be reading this because they’ve been derailed by any number of reasons. Likewise, the top 20% aren’t paying attention to me because they’re too busy operating ultra-successful enterprises.
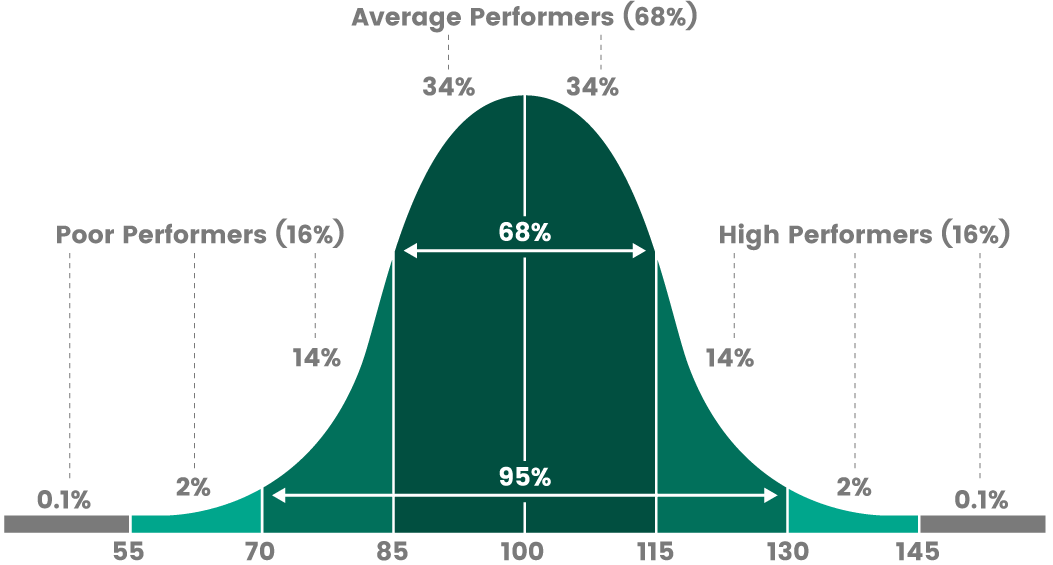
The truly interesting thing is that you can track these bell curves down to the most minute detail. For instance, the next chart actually narrows the criteria for being considered a top-performing business. In this chart, only the top 16% are considered top-performers, with the truly elite checking in between 2% and 0.1%. This leaves 95% to the median average range.
What Does Any of This Have to do With The Value Gap?
In order to answer this question properly, I’m going to first quote Dennis Roberts. In his book, Mergers & Acquisitions: An Insider’s Guide to the Purchase and Sale of Middle Market Business Interests, Dennis says, “This chapter presents the rule of five and the super rule of five together with the rule of ten, which are invaluable in Middle Market investment banking, and increase business sales. The rule of five and the super rule of five provide a useful frame of reference for both buyers and sellers in constructing a rationale for a given purchase price.
The foundation rule of five, when combined with the rule of ten, is very useful as a starting point, whether launching a complex formal business valuation for an expert opinion or simply around the preliminary value of a client’s Middle Market company. The rule of five holds that any Middle Market business will be worth approximately five times its cash flow before interest expense and income taxes until demonstrated otherwise. In most transactions, price is determined by some combination of the standalone growth rate of the target and the value of expected synergies to the ultimate buyer in the negotiated auction. That is, in fact, the application of the super rule of five in practice, especially it applies to the Lower Middle Market.”
The Rule of Five
If we are looking at the bell curve, once again, the rule of five would look something like this. At the corona position (the very crest of the bell) you have the number 5. That means that all the way to the left of the mean is 0, and to the right, is an unknown value. This value could be 10, 20, maybe even 40. We don’t know because it depends on the individual circumstances within your industry. But there is this group of businesses that make up the best-in-class of your industry.
Once again, your business falls somewhere on this bell curve. If it’s a 2, then your business is below average. If you’re valued at 5 then it’s average. However, if your business falls in at 7, then you’re slightly above average. But, what if you could take your business from a multiple of five to the top 2 or 3%? If your business were valued at $100,000 with a multiplier of five, then your business is suddenly worth $500,000. But what if I told you that you could change from a five times multiplier to a ten times multiplier without adding revenue to your business?
You see, using this same simple example, you’ve narrowed your value gap by $500,000. We will discuss this in greater detail, but it’s possible to narrow the gap from where your business is currently valued to what its potential is, without adding revenues.
In Conclusion…
I don’t know about you, but that stirs me. I don’t want to be average. Knowing that I can bridge the value gap in my business is a gamechanger. So, let me ask you this, do you know your value gap? See, if you knew that, that’s one of those things that could help you sleep better at night, as a business owner. If you don’t know your value gap, or if you aren’t sure how to increase your multiplier, reach out to us. We do this every single day. Helping business owners realize their dreams is our passion.
Folks, life is hard. It’s challenging. But life is good. Knowing how to bridge your value gap can be frustrating but it doesn’t need to be. Reach out to us and let us make closing your value gap, at least, financially simple. Hey, let’s go out and make it a great day!
If you have questions about this or other business and financial topics, reach out to us. The team at Financially Simple is always ready to help!