
11 Business Lessons from 2020: Applying Them to 2021
December 29, 2020
Measuring Value Improvement of A Business: What to Know
January 1, 2021The Profitability Gap: A Business Owner’s Guide

We are circling back around to the things that cause business owners to be fearful, anxious, or to lose sleep at night. Up to this point, we’ve covered, in great detail, the wealth gap and the value gap. With today’s post, I want to explore the profitability gap. What is it? How do we track it? These are some of the questions that I will be answering. So, join me as I shed some light on this subject and how it affects your business.
Follow Along With The Financially Simple Experience!
TIME INDEX:
- 00:54 – What is the Profitability Gap?
- 02:30 – Basic Income Statement Accounting
- 07:04 – Industry Specific
- 09:05 – Comparing Within Your Own Industry
- 10:00 – Best in Class
- 12:39 – Calculating Your Profitability Gap
- 14:48 – Summary
What is a Profitability Gap?
We’ve spent some time dealing with gaps at this point. Basically, any type of financial gap is the difference between where you are and where you want to be. So, with that in mind, what does it mean to have a profitability gap? In order to answer that, I want you to think about what your profits would look like if your company were a best-in-class business. Would you have more money to take home than you do now? If the answer is yes, then you have a gap that can be made up in your business’ profitability.
In order to calculate the difference between your company’s current profits and where they could potentially be, we need to do some income statement accounting. You might call it a P&L but they are, essentially, the same thing. So, whatever you call it within your company, you’ll need to learn how to do some basic income statement accounting. Let’s take a look at it, then.
Income Statement Accounting 101
I’m going to oversimplify this, but it will give you the general idea of how to do this. However, my next book, which comes out next year, really goes into great detail on this concept. It will show you how to drive this home and really bring home the bacon. So, there it is. That’s my shameless plug, folks. But getting back on track, there are a couple of different headings that you’re really going to key in on.
At the very top of your income statement, is your revenue. This is how you get paid, as the business owner. For simplicity’s sake, let’s say that your revenue is right at $82,000. Not everyone is going to have this, but many of you will have a Cost of Goods Sold (COGS) coming right off the top of your revenues. This line item relates to the items you sell and what they cost you. For example, my brother owns a pool business. His COGS include chlorine, rebar, and other items that he pays for to create the goods that he sells.
When we subtract COGS from our revenues, it gives us the Gross Profit. So, if your income statement shows that you have $82,108 in revenues but your COGS are $31,201, that means your gross profit is $50,907. You’re looking at a 62% profit margin. That’s fantastic! But we aren’t done yet.
Accounting for Expenses, Depreciation, and Amortization
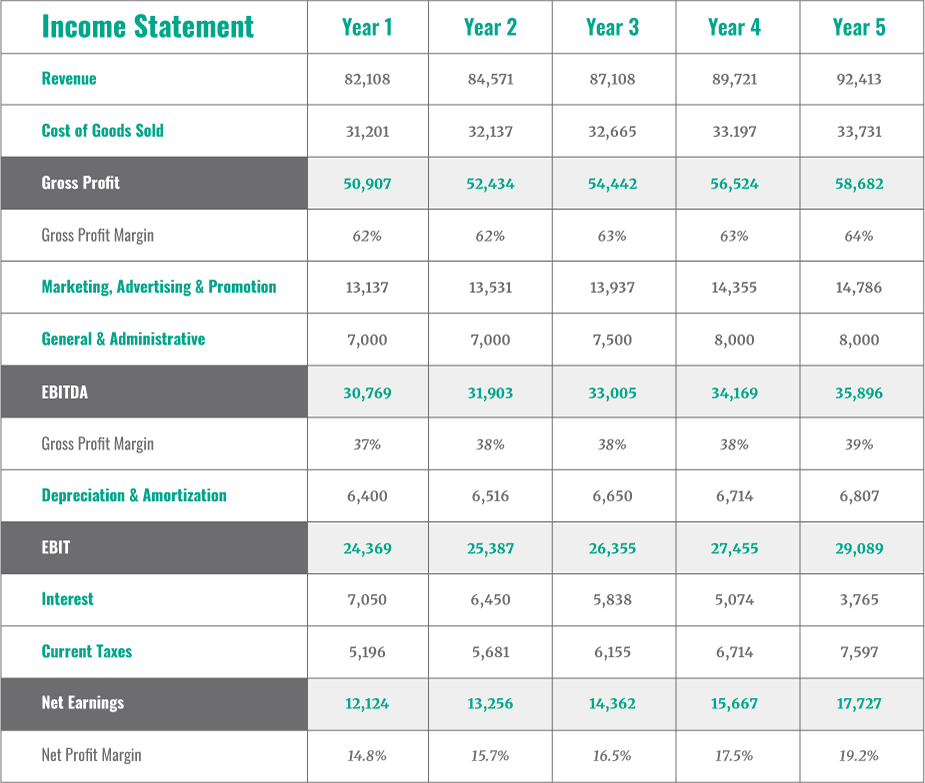
Expenses can come into the income statement in a variety of different ways. This could be anything from salaries to marketing. When we deduct our expenses from our gross profit, we find our Earnings Before Interest, Taxes, Depreciation & Amortization (EBITDA). In this case, we began with a gross profit of $50,907. As you can see in the income statement below, we have expenses from marketing, advertising, promotion, general, and administrative that total $20,137. After subtracting our expenses from our gross profits, we end up with an EBITDA of $30,769. This brings our gross profit margin down to 37%.
Following the logical pattern of the income statement, we subtract depreciation and amortization next. Our EBITDA was $30,769. Once we subtract the $6,400, we end up with an EBIT of $24,369. So, what’s the next step? You guessed it! We find our Net Earnings by subtracting the interest that we’ve paid on loans and our current taxes from our EBIT. In the end, we have net earnings of $12,124. When we divide our net earnings by our revenues, we end up with a 14.8% Net Profit Margin.
As you can see, the net earnings are a far cry from the revenue that we began with. You see, most business owners don’t think about it in this way. We’re not thinking about how much money we make versus what we get to keep. But when we are dealing with the profit gap, we need to look at the net profit margin and determine if it is above or below average relative to your industry.
By Industry Standards
You may be wondering why the specific industry matters in regards to net profit margin. Well, think about this… a law firm isn’t likely to carry the same type of overhead that a construction company would have. On the one hand, you’ve got a building, utilities, internet, and office supplies. On the other, you’ve got all of that plus heavy machinery, tools, and equipment. It’s the same thing across all industries. Different industries have different costs associated with them. Therefore, what might be a best-in-class net profit margin in one industry could be average in another.
Additionally, it’s important to compare your profit margin with companies in the same Standard Industrial Classification (SIC) or National Industrial Classification (NIC) codes. You see, we want a true “apples to apples” comparison. If you’re a lawyer who specializes in estate planning, you don’t necessarily want to compare your profit margin to that of an intellectual property firm. Likewise, a construction firm that primarily deals in residential construction shouldn’t be comparing profit margins with one that contracts for the highway department. The only way to get an accurate picture of where your company’s net profit margin stacks up is to compare it to the most similar businesses in your industry.
Finding the Best-in-Class
When you look at your 14.8% net profit margin on its own, you might be a little discouraged. However, depending on your industry, that might be a great margin. According to the Corporate Finance Institute, a good margin will vary considerably by industry, but as a general rule of thumb, a 10% net profit margin is considered average, a 20% margin is considered good, and a 5% margin is low.
If you’ll remember, we discussed the bell curve a few posts ago. You can look at the variance or range of profit margins in your industry and place them on a bell curve to find the best-in-class within your industry. When you put your net profit margin on your industry’s bell curve, you might find that your profit margin is average. But the point of calculating the profit gap isn’t to be average. You want to be exceptional. You want your business to be the best-in-class in your industry.
RELATED READING: What is the Value Gap?
The only way to become the best-in-class is to know what the best-in-class businesses within the same industry and SIC/NIC codes profit margins are. Once you’ve identified them, you can see where you are in comparison. Most industry firms or associations will provide you with these data points. So, it isn’t difficult to find this information, friends.
Calculating Your Profitability Gap
The first step is to do the income statement accounting that we just discussed, to calculate your net profit margin. After you’ve calculated your profit margin for 2020 (which may be a bit bleak for many business owners), go backward. Calculate your net profit margin for 2019, then 2018, 2017, and 2016. Is there a trend that shows that your profit margin is increasing?
As you’re working to increase your profit margin, there needs to be a target. It’s like the old saying, “if you aim at nothing, you’ll hit it every time.” So, there needs to be a clear target for you to reach. But how do you find your target? Well, who is it that you look up to? What business in your industry is leading the way in teaching other business owners in your SIC code?
You see, I know a few dentists who are producing a marginal take-home rate that is near 40%. They aren’t an anomaly. They’re on the right side of the profitability curve. So, when I see a client that is only producing a 20% margin, I can see that there is a 20% gap in their business. If we could produce an additional 20% in their business, what do you think that would do for their lives? What about their mental state? The good news is, many people don’t need an extra 20%. They only need 2-5% to close their gap.
So, let me close with this. What is your profit margin? What is the best-in-class profit margin in your industry and SIC code? Is there a difference? If there is, I want you to ask yourself what you would do differently, in your life, if you had the difference in your pocket? Let that motivate you.
Wrapping Up…
Friends, there are things in our businesses that cause us stress, fear, and frustration. But when we understand how to confront these issues, they suddenly become very manageable. When we know what we’re facing, we can approach our business with confidence, knowing that we control our destiny. Life is hard. It can be complicated, but life is good. Once we understand how to calculate the profit gap, we can make bridging that divide at least financially simple.
Handling this and other business issues can be quite taxing. If you have questions or just need someone to help you right your ship, schedule a meeting with us. The Financially Simple team is always here to help.